This site provides resources for nowcasting the weather in the Southwestern United States (centered on North-Central Arizona), particularly for use during the North American Monsoon each year (June 15-September 30).
Nowcasting is the process of predicting weather over short time periods for use in a variety of applications (severe weather warnings, transportation management, utility companies, public safety, etc.).
It seeks to improve upon the accuracy of numerical weather prediction models for up to 6 hours into the future, providing timely information about immediate weather events, particularly those with potential for high impact, like severe thunderstorms or flash flooding.
Contact Us
- Curtis James, Professor of Meteorology
- For more information, contact: James61c@erau.edu
- Real-time data: Nowcasting relies heavily on continuous monitoring of real-time observational data.
- Extrapolation techniques: Nowcasting often involves extrapolating known weather trends forward in time, such as precipitation patterns or storm motion, based on current observations.
- Integration with numerical weather prediction (NWP): While nowcasting initially focuses on extrapolation, it increasingly incorporates output from high-resolution NWP models to enhance accuracy, especially for longer lead times (e.g., from 2-6 hours).
- Blending of data: Advanced nowcasting systems fuse data from various sources to create a more comprehensive and accurate picture of the current weather and its evolution.
- Time scale: Nowcasting focuses on very short-term periods (minutes to hours), while traditional forecasting covers longer periods (days or weeks).
- Methodology: Nowcasting relies on real-time data and extrapolation, often combined with NWP, while traditional forecasting primarily utilizes complex NWP models that simulate atmospheric dynamics.
- Data availability and quality: Reliable and high-resolution real-time data are essential for effective nowcasting, which can be a challenge in certain regions.
- Computational resources: Processing the large volume of real-time data and running high-resolution models can be computationally intensive.
- Model complexity: Developing models that accurately capture the rapid and complex evolution of weather phenomena over short time scales is challenging.
- Model interpretability: Understanding the reasoning behind nowcasting predictions, especially from complex machine learning models, can be difficult.
- Machine learning forecasts: Causality-Defined Machine Learning (CDML) model forecasts of precipitation in a side-by-side comparison with operational High-Resolution Rapid Refresh model forecasts (https://rapidrefresh.noaa.gov/hrrr/). These forecasts were created through an Early-concept Grants for Exploratory Research (EAGER) grant from the National Science Foundation.
- Real-time radar data, including MRMS-based precipitation maps for the Southwest and current radar image sectors and loops obtained from Embry-Riddle’s Honeywell IntuVue RDR-7000 weather radar. The RDR-7000 radar was permanently consigned to the Prescott Campus of Embry-Riddle by Honeywell International Inc., with generous support by private donors Rudy Miller, the Miller Group, and Marc Collins, ERAU alumnus.
- Live webcam imagery and loops
- Recent upper-air soundings for Prescott, Arizona, created using a combination of recent Embry-Riddle airborne data and computer model forecasts
- The latest weekly weather forecast discussion from Embry-Riddle faculty and students
Causality-Defined Machine Learning (CDML) is a machine-learning based model that was constructed using Entropic Regression (ER) as an extended Granger causality/causation entropy method with a nonlinear polynomial expansion of 128 selected forecast variables from the operational HRRR (High-Resolution Rapid Refresh (HRRR) model (https://rapidrefresh.noaa.gov/hrrr/). ER helped us to identify the causal parents, a set of 6 forecast variables sufficient to model the dynamics of precipitation in the Southwestern U.S. (the domain of the model is shown below). This was achieved by evaluating the probability of each variable influencing precipitation within small geographic subregions (called superpixels), and combining the overall skill of these variables across the entire domain.
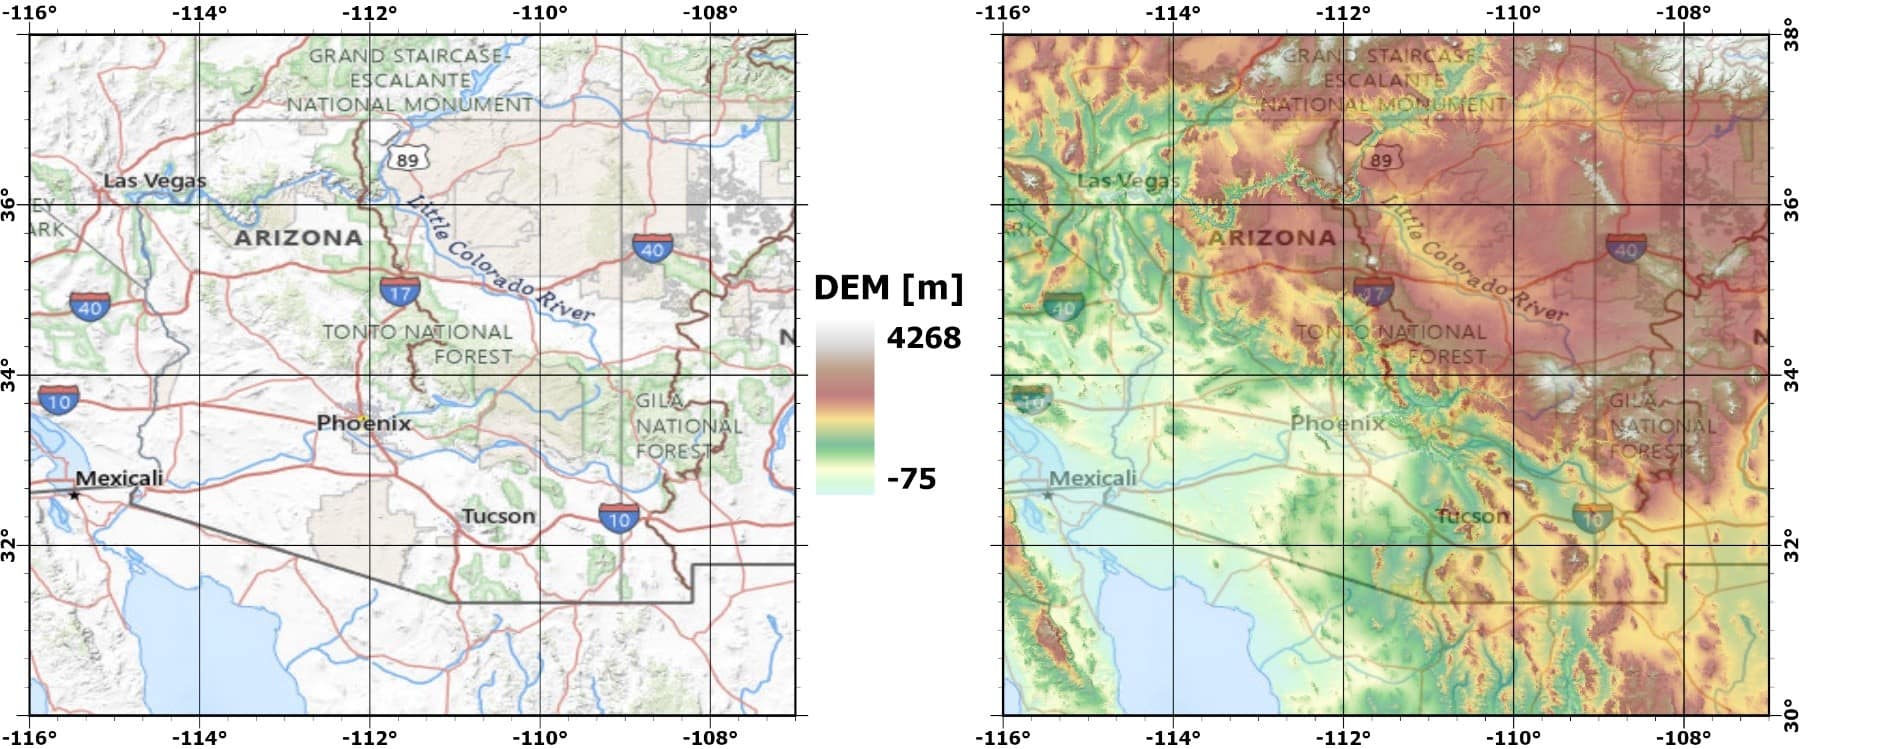
Figure 1: The CDML model domain covering much of the Southwestern U.S., as depicted showing (a) political boundaries and highways and (b) topographic elevation (m).
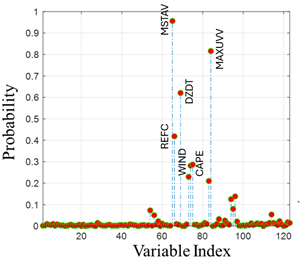
The six causal parent variables that were selected for creating the CDML model were as follows (see the probabilities in Fig. 2).
- MSTAV: Surface moisture availability [%]: 0 m underground (anal.)
- MAXUVV: Hourly maximum of upward vertical velocity [m/s]: 400-1000 mb above ground (0-1 hour max fcst)
- DZDT: Vertical velocity (Geometric) [m/s]: 0.5-0.8 sigma layer (anal.)
- REFC: Composite reflectivity [dB]: entire atmosphere (anal.)
- CAPE: Convective avail. potential energy [J/kg]: surface (1 hour fcst)
- WIND: Wind speed [m/s]:10 m above ground (0-1 hour max fcst)
Real-time Radar Data
The Multi-Radar / Multi-Sensor (MRMS) precipitation rate (in/h) dataset (https://www.nssl.noaa.gov/projects/mrms/) updates every two minutes, and is create using a combination of all available WSR-88D radars from across the Southwest (https://journals.ametsoc.org/view/journals/bams/97/4/bams-d-14-00174.1.xml).
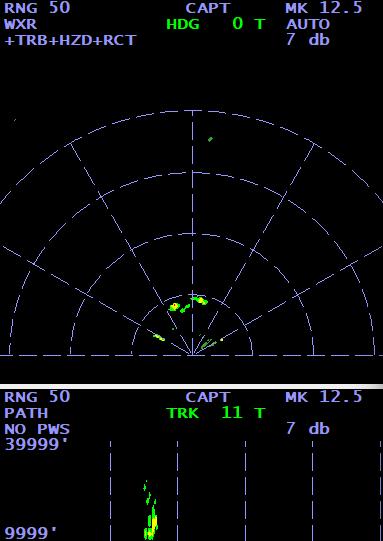
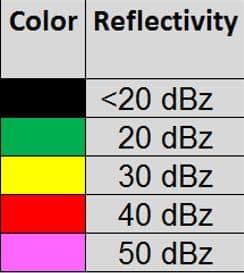
The Honeywell IntuVue RDR-7000 Radar is located atop the Academic Complex at Embry-Riddle Aeronautical University, located at 34.615296°N; 112.451188°W at about 90 ft AGL. This radar provides a 120-degree wide sector volume scan in any compass direction or azimuth specified by the user. The sector volume is continuously updating, with a screen capture is created every 1 minute and displayed on this website (see the sample screen capture in Fig. 1 below). The radar is located at the bottom of the sector volume in the top panel, with the center of the sector scan pointing upward on the panel. The radar location in the vertical cross-section in the bottom panel is at the bottom left-hand side. The top panel shows composite reflectivity (using the color table shown in Fig. 2), turbulence (white), hazardous weather (hatched), and attenuated regions (cyan). The white line depicts the location of the vertical cross-section shown in the bottom panel. The bottom panel shows reflectivity along the vertical cross-section, with the base and top height (MSL) at the bottom left and top left of the cross-section.

Fig. 1 Sample screen capture of the Honeywell radar display.
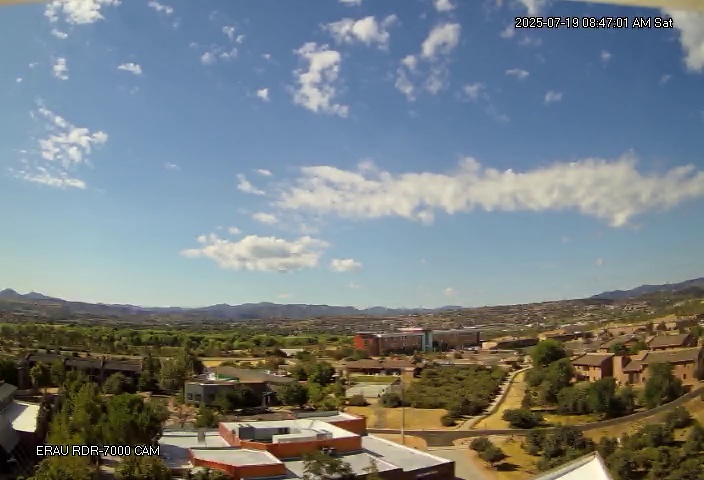
The webcam is pointed in the same direction as the center of the radar’s sector scan. It is a Lorex 4K 8MP IP Dome PoE Wired Security Camera (Indoor/Outdoor), and updates are uploaded every minute. These images provide the user with a visual perspective of the cloud types and formations associated with the observed reflectivity patterns.
Current Forecasts for Prescott
Experimental Monsoon Precipitation Forecasts
Date/Time
CDML Hourly Precipitation Forecast (inches)
Link to georeferenced data in ArcGIS Online
Date/Time
CDML Hourly Precipitation Probability (%)
Link to georeferenced data in ArcGIS Online
Date/Time
HRRR Hourly Precipitation Forecast (inches)
Link to georeferenced data in ArcGIS Online
Date/Time
CDML Maximum Precipitation Possible (inches)
Link to georeferenced data in ArcGIS Online
Recent Upper-Air Soundings for Prescott, Arizona
Embry-Riddle Aeronautical University operates a fleet of approximately 70 Cessna 172 aircraft for collegiate flight training. We have begun to instrument a small number of these aircraft with AIMMS30 meteorological data probes (https://aventech.com/products/aimms30.html) during flight and archiving the data. When available, we will display synthetic upper-air soundings created by combining HRRR model data and the data measured by these probes, showing the local temperature (red), dew point temperature (blue), and wind (black) over the Prescott airport (KPRC). Other CONVECTIVE parameters are also shown, including Convective Available Potential Energy (CAPE), Convective Inhibition (CIN), 0-3 km AGL shear, and various convective indices generally used in meteorological analysis and forecasting. NOTE: Care should be taken to note the date and time of the sounding and examine how representative the data appear on the sounding compared to the HRRR model forecast.